Updated datasets
Last updated 25 October 2026
These are series from papers I really enjoyed reading, the kind I keep coming back to, and that is why I chose to keep them going. I like to keep useful datasets up to date. Many series used in finance research stop where a paper’s sample ends, or when the database behind them closes. Here I extend them with the latest figures from the original sources and post each one with the code that rebuilds it, so you can check every step or run the update yourself.
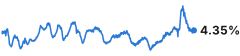
- Job openings-to-employment ratioJob openings as a share of employment. A high ratio has been followed by lower stock market returns.
- [chart and notes]
- [CSV]
- [Python]
- [MATLAB]
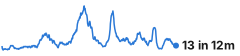
- Large public-company bankruptciesChapter 7 and 11 petitions by US public companies with assets over $100 million in 1980 dollars, continued from SEC filings with the database’s own definition.
- [chart and notes]
- [CSV]
- [case list]
- [Python]
- [MATLAB]
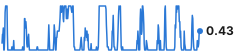
- Technical trend indicatorsThe paper’s fourteen buy and sell rules, replicated exactly and updated, and the same price rules for oil, metals and crops, and a trend uncertainty index (the share of rules on sell) that tracks the VIX.
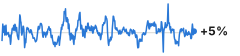
- Oil supply, demand and risk shocksEach month’s oil price change split into supply, demand and risk shocks using oil producers’ share returns and VIX innovations, rebuilt from free data and checked against the paper. Supply shocks are bad for stocks, demand shocks good.
- [chart and notes]
- [CSV]
- [Python]
- [MATLAB]
Each page explains how the series is built, what to watch out for when using it, and how to cite it. If a figure looks wrong, please let me know.
Looking for other data? My guide to data for empirical finance covers more than 80 sources, from Kenneth French’s factors to uncertainty indexes and yield curves.